

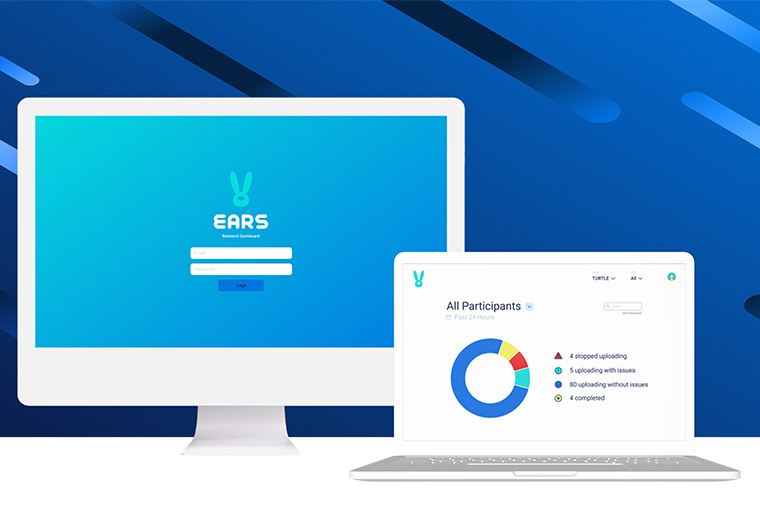
EARS
MENTAL HEALTH MONITORING DASHBOARD
Product
Research dashboard and data visualization
Project Roles
Web App Development
UI/UX Design
Data Visualization
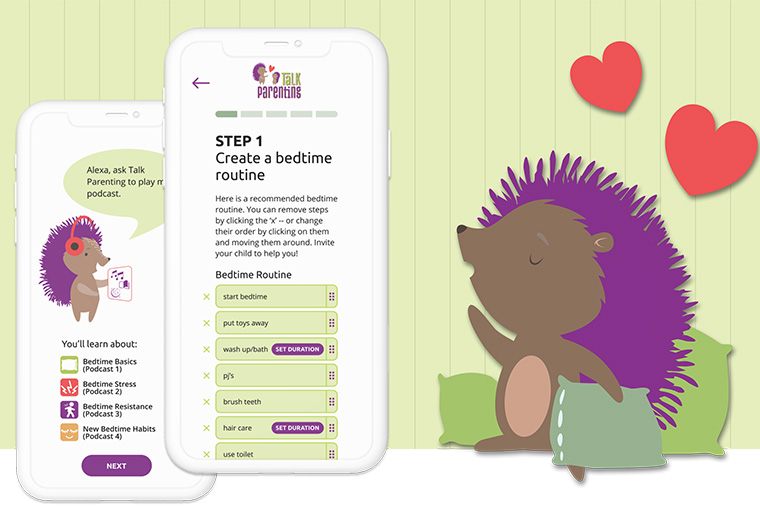
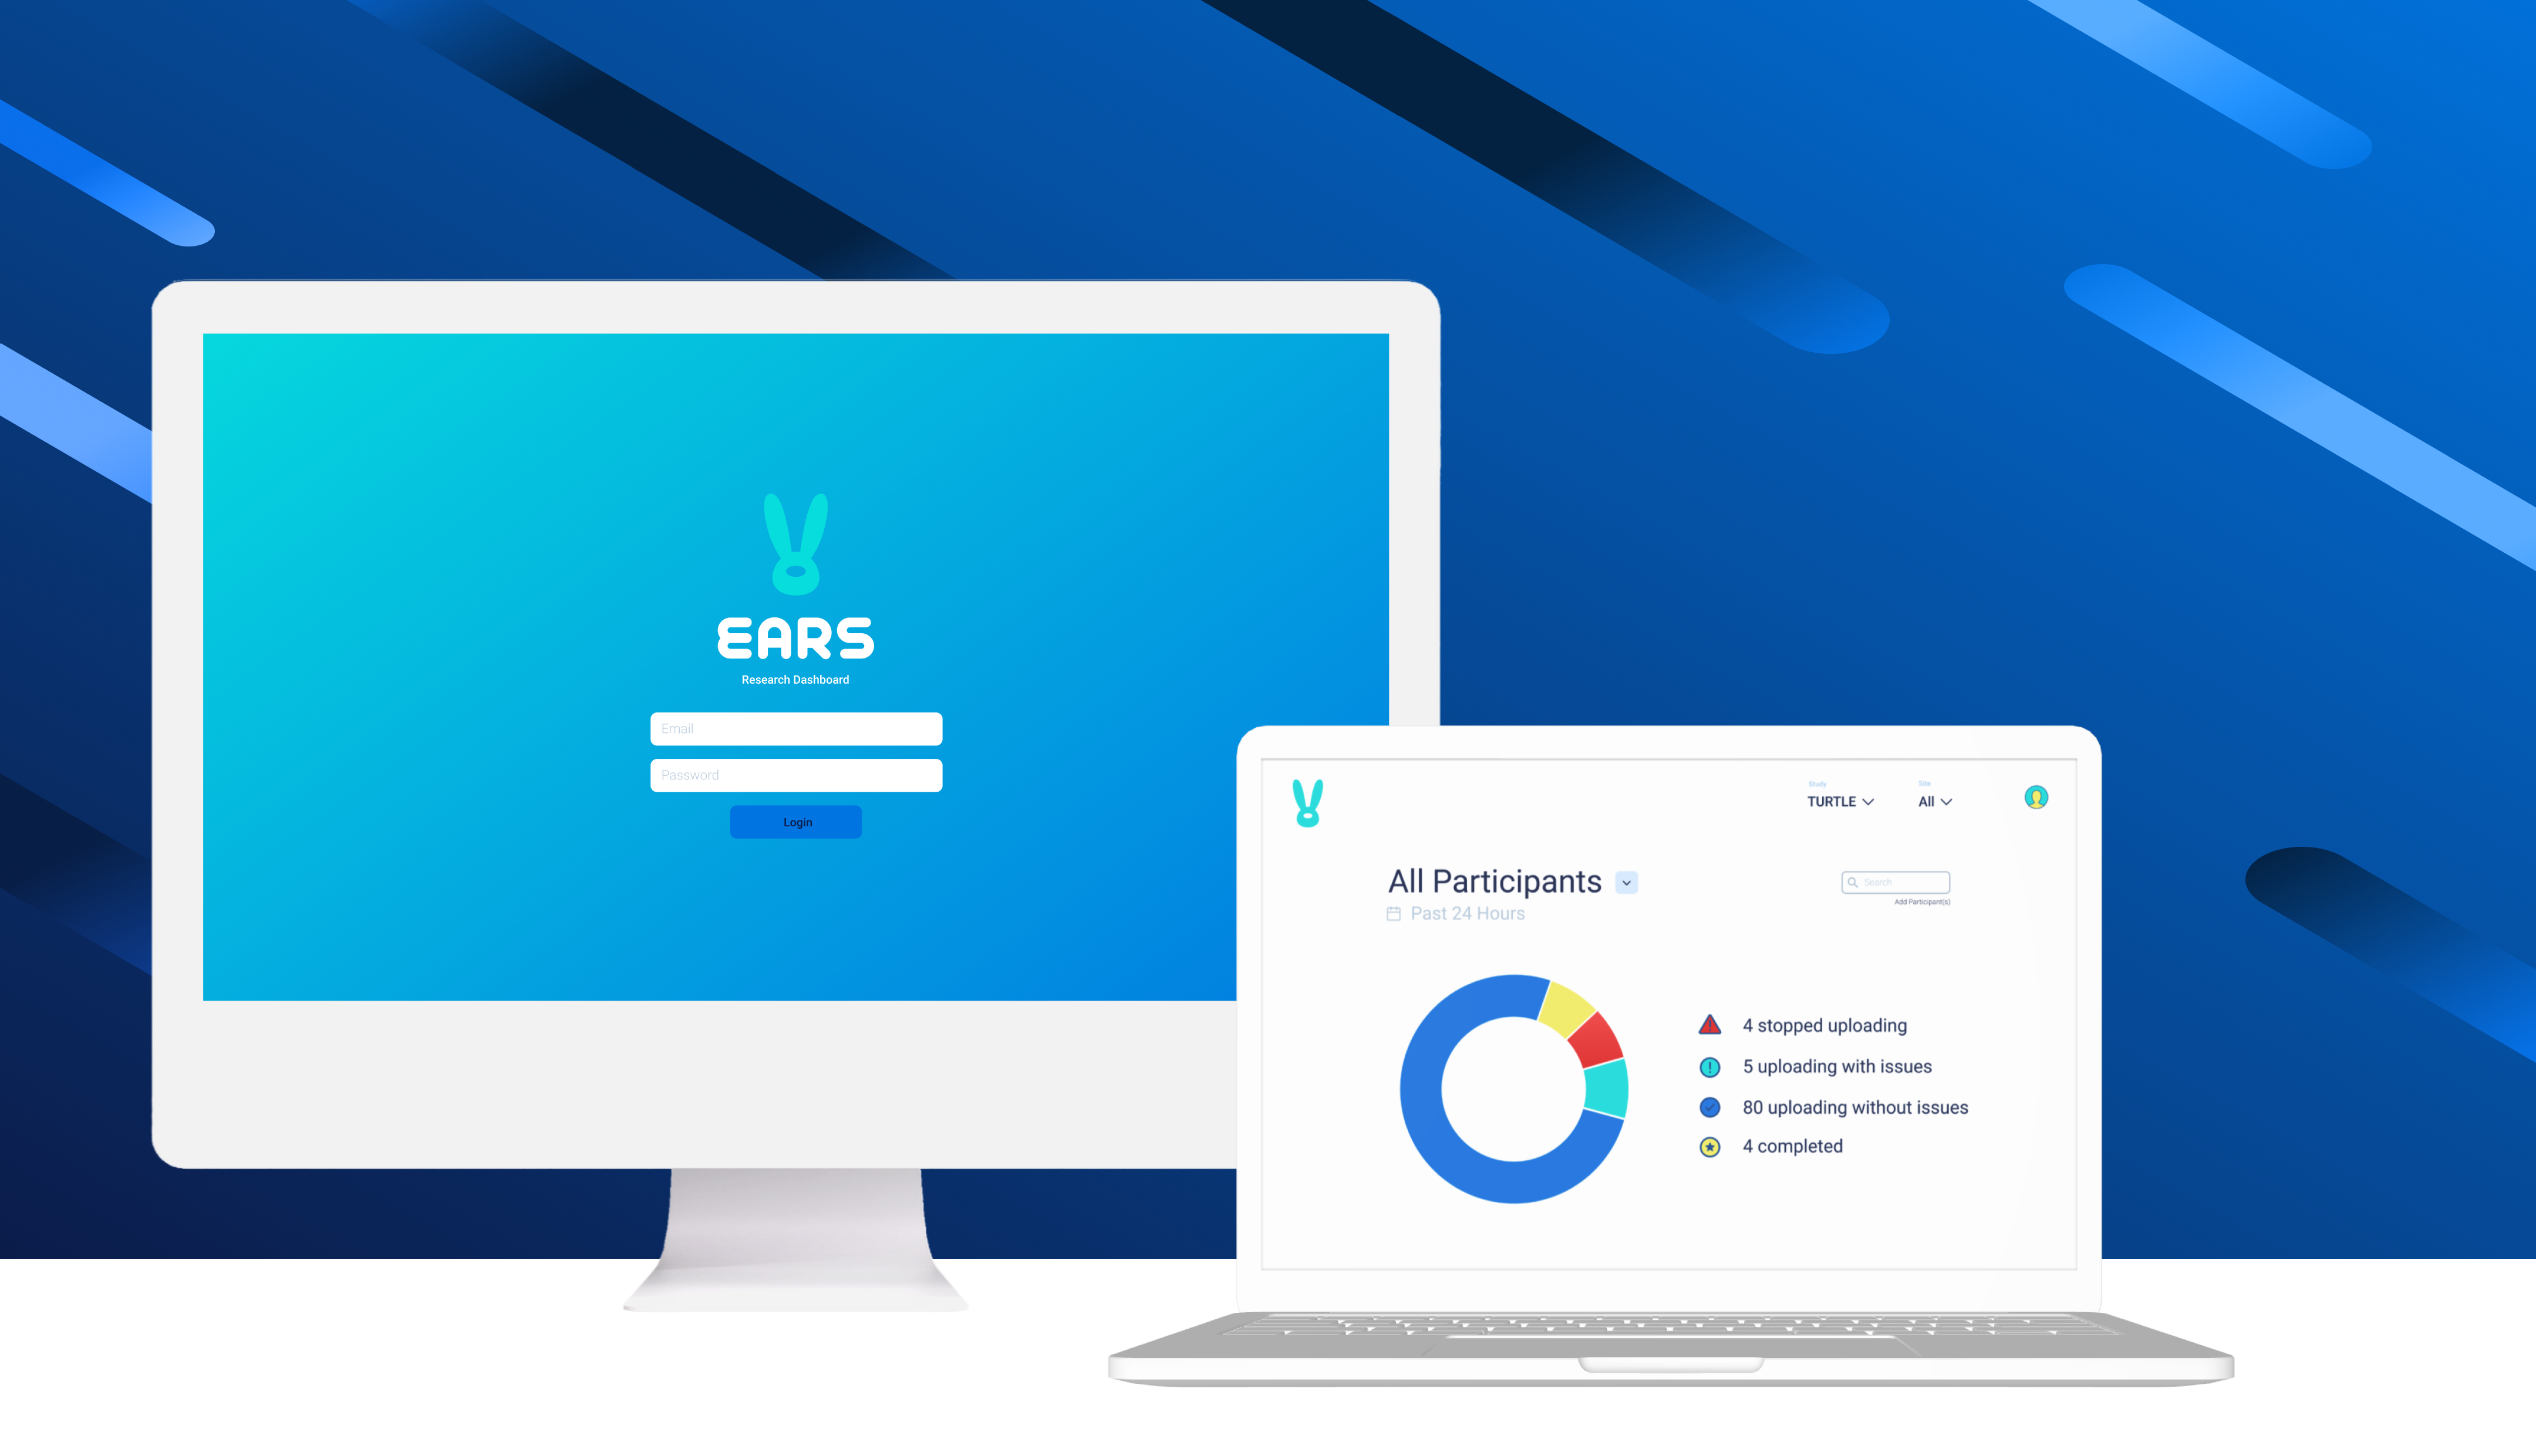
THE CHALLENGE
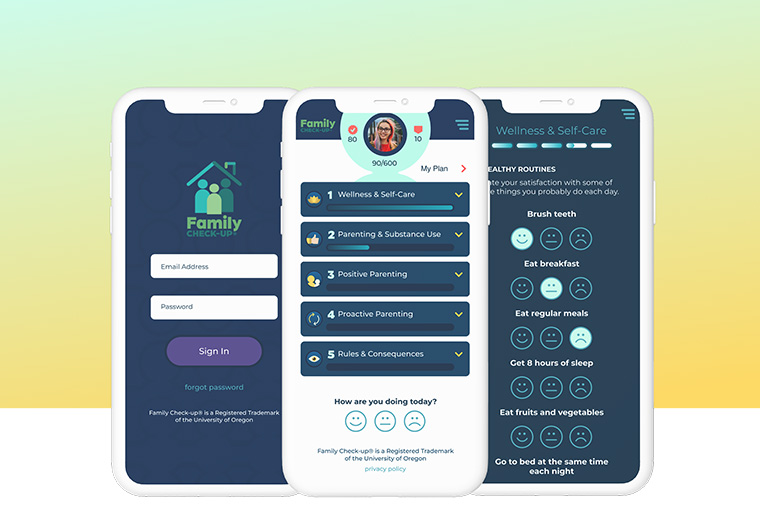
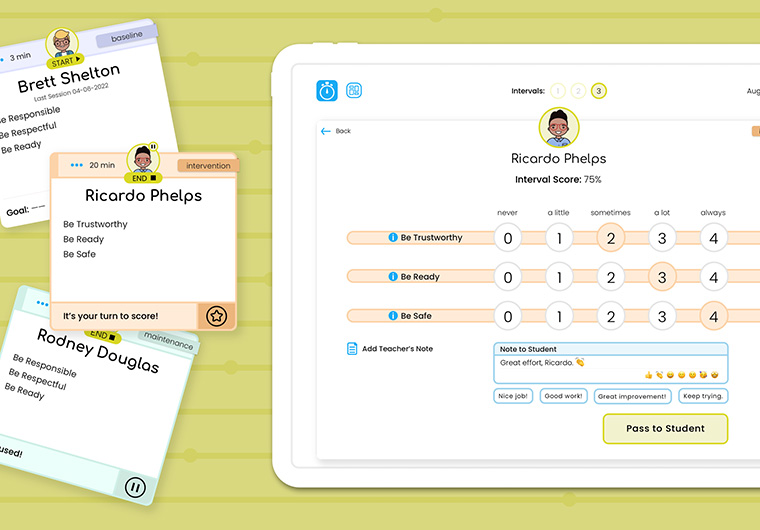
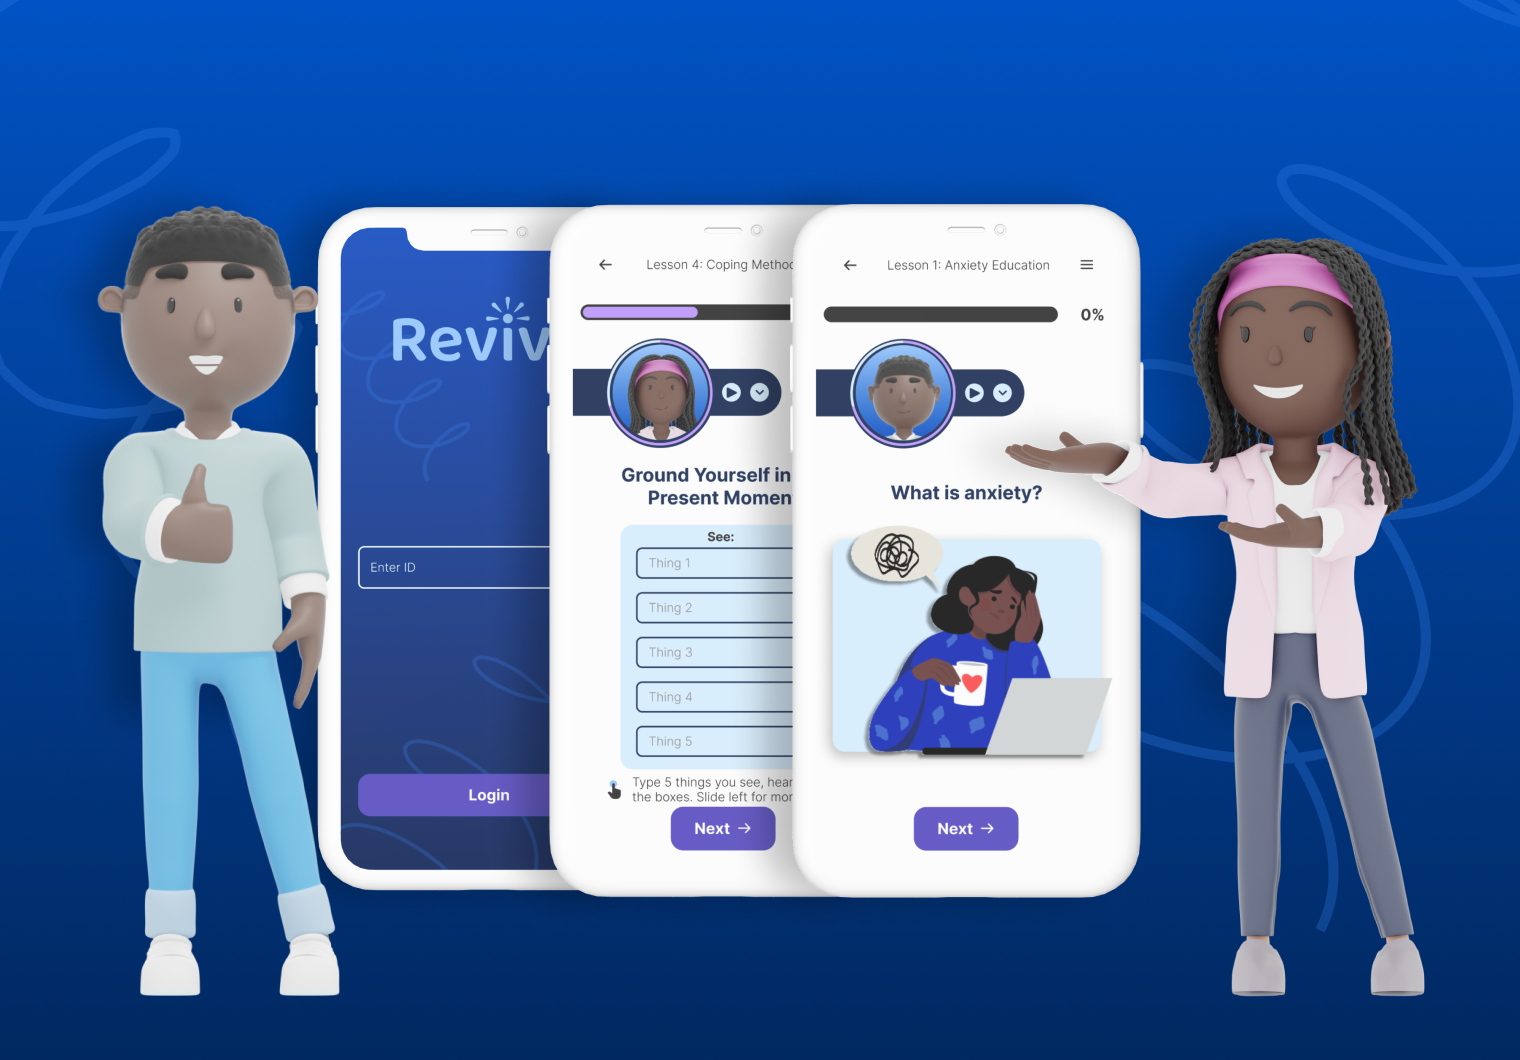
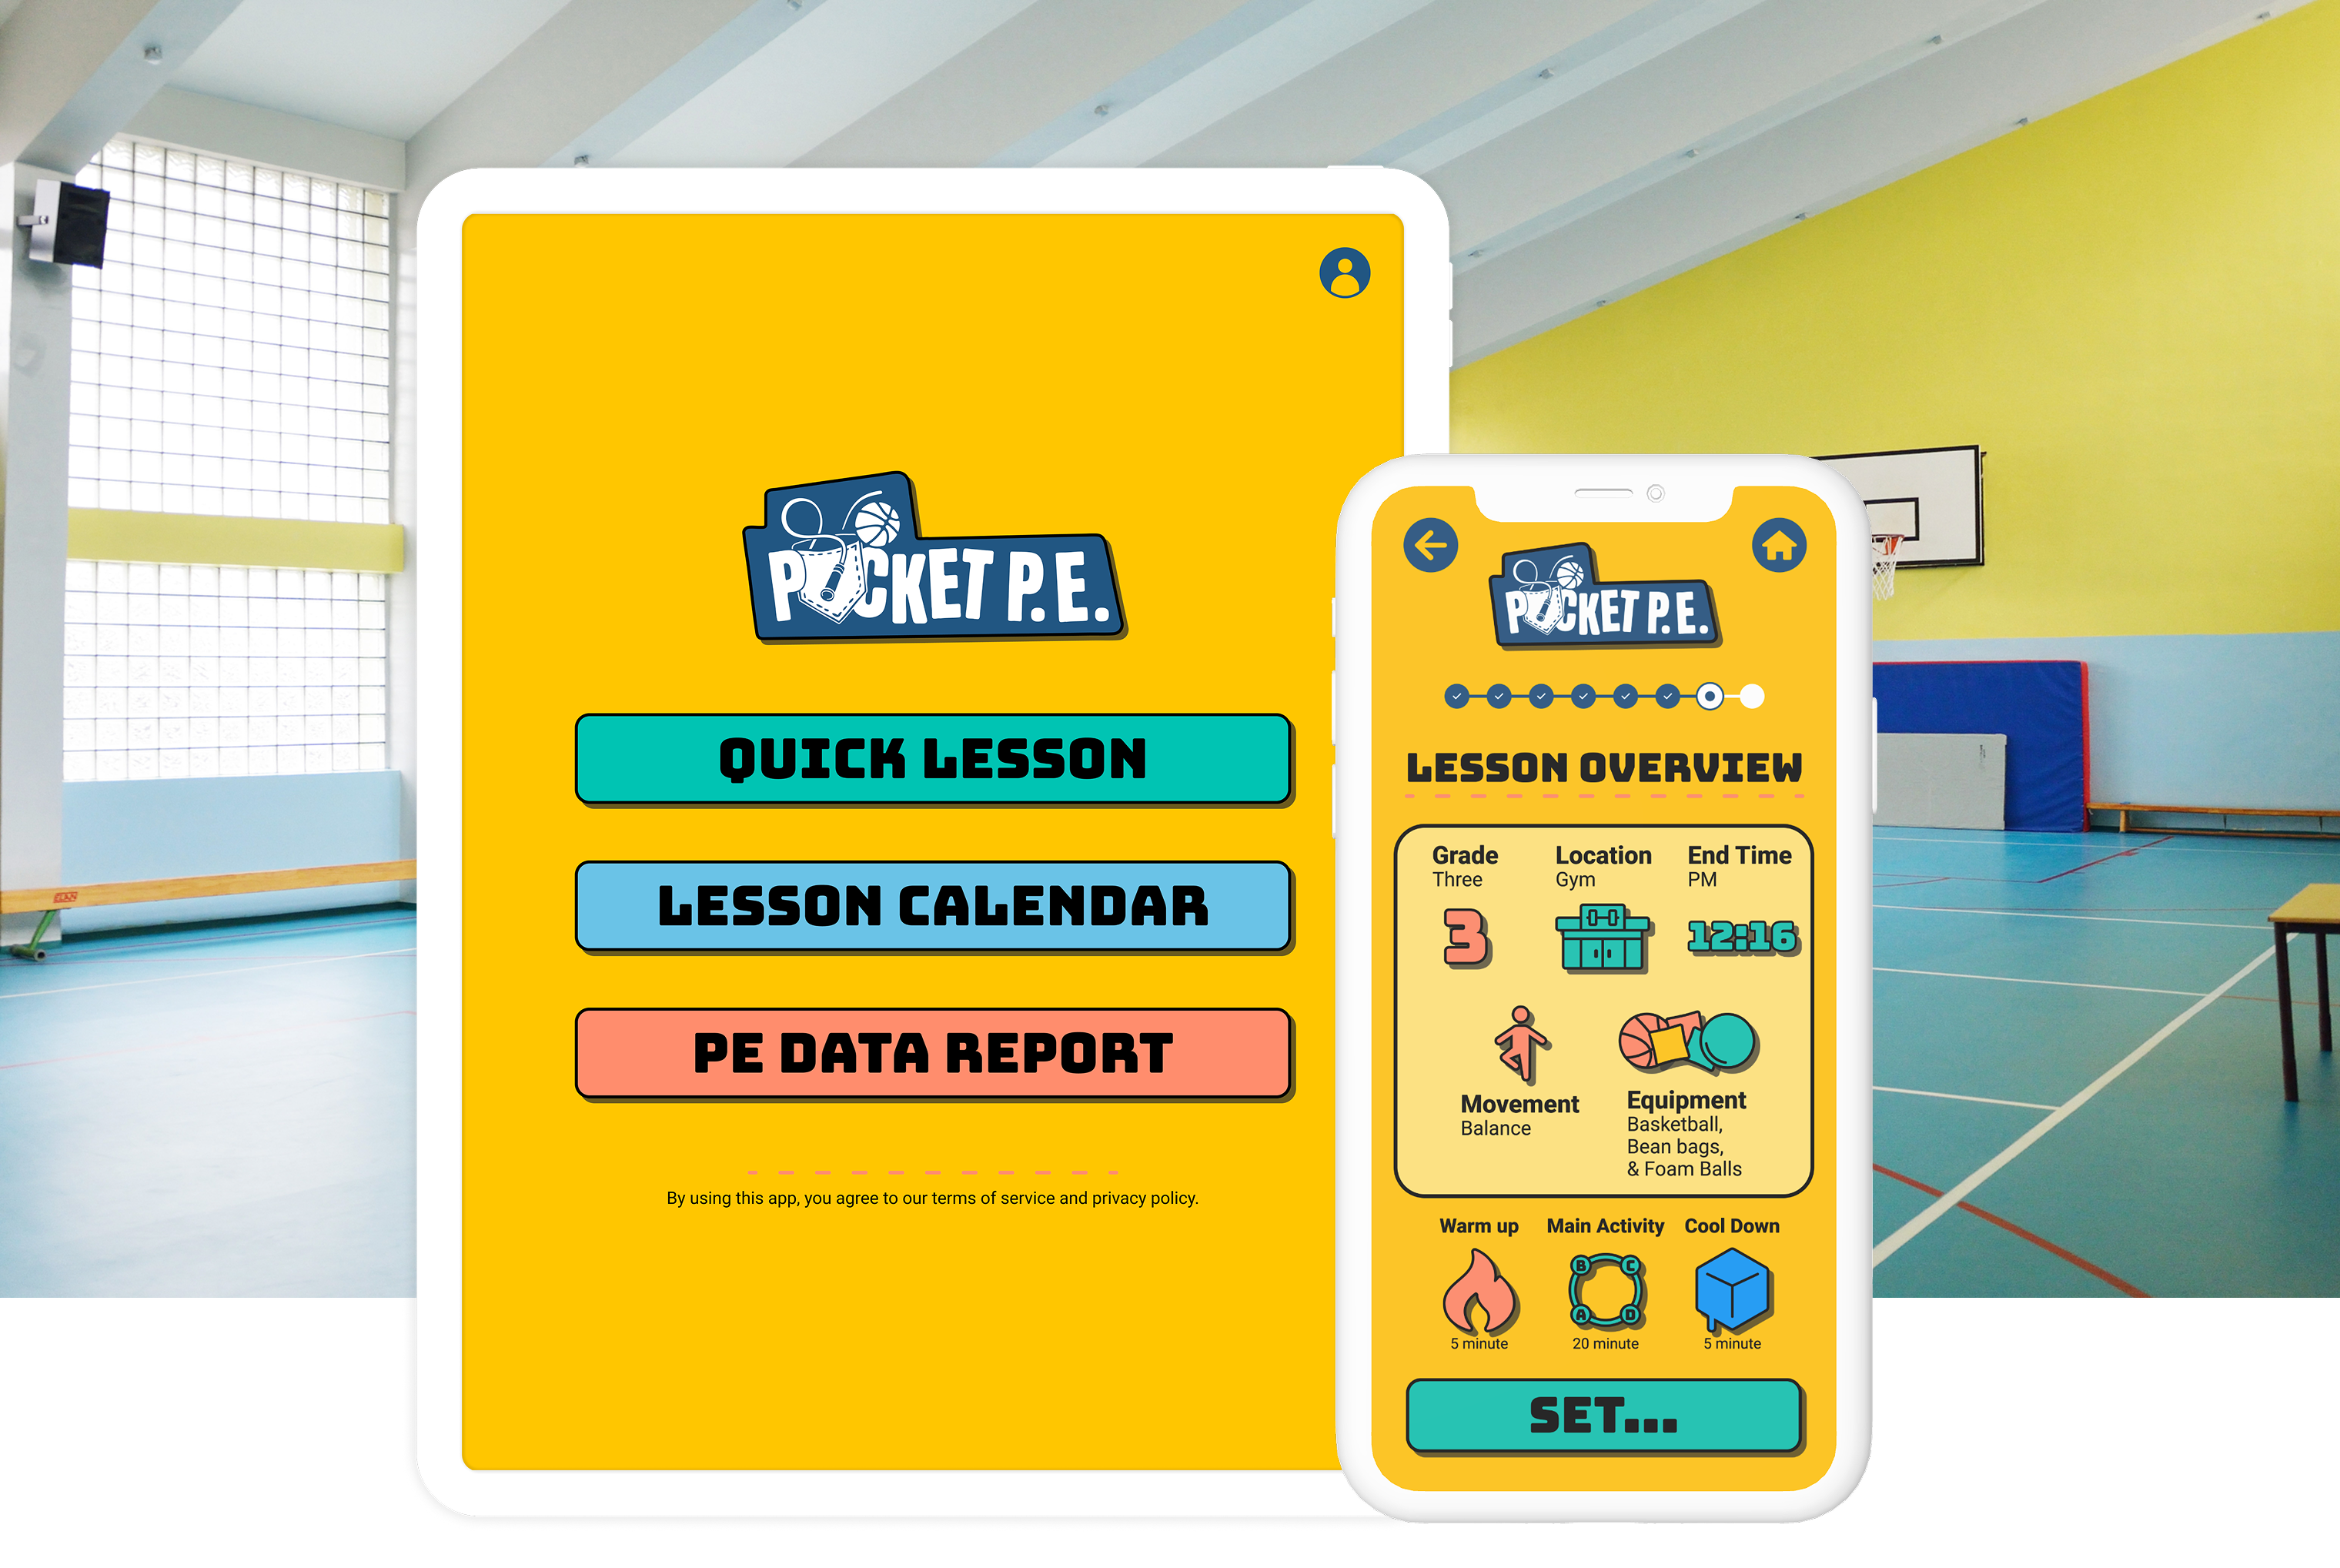
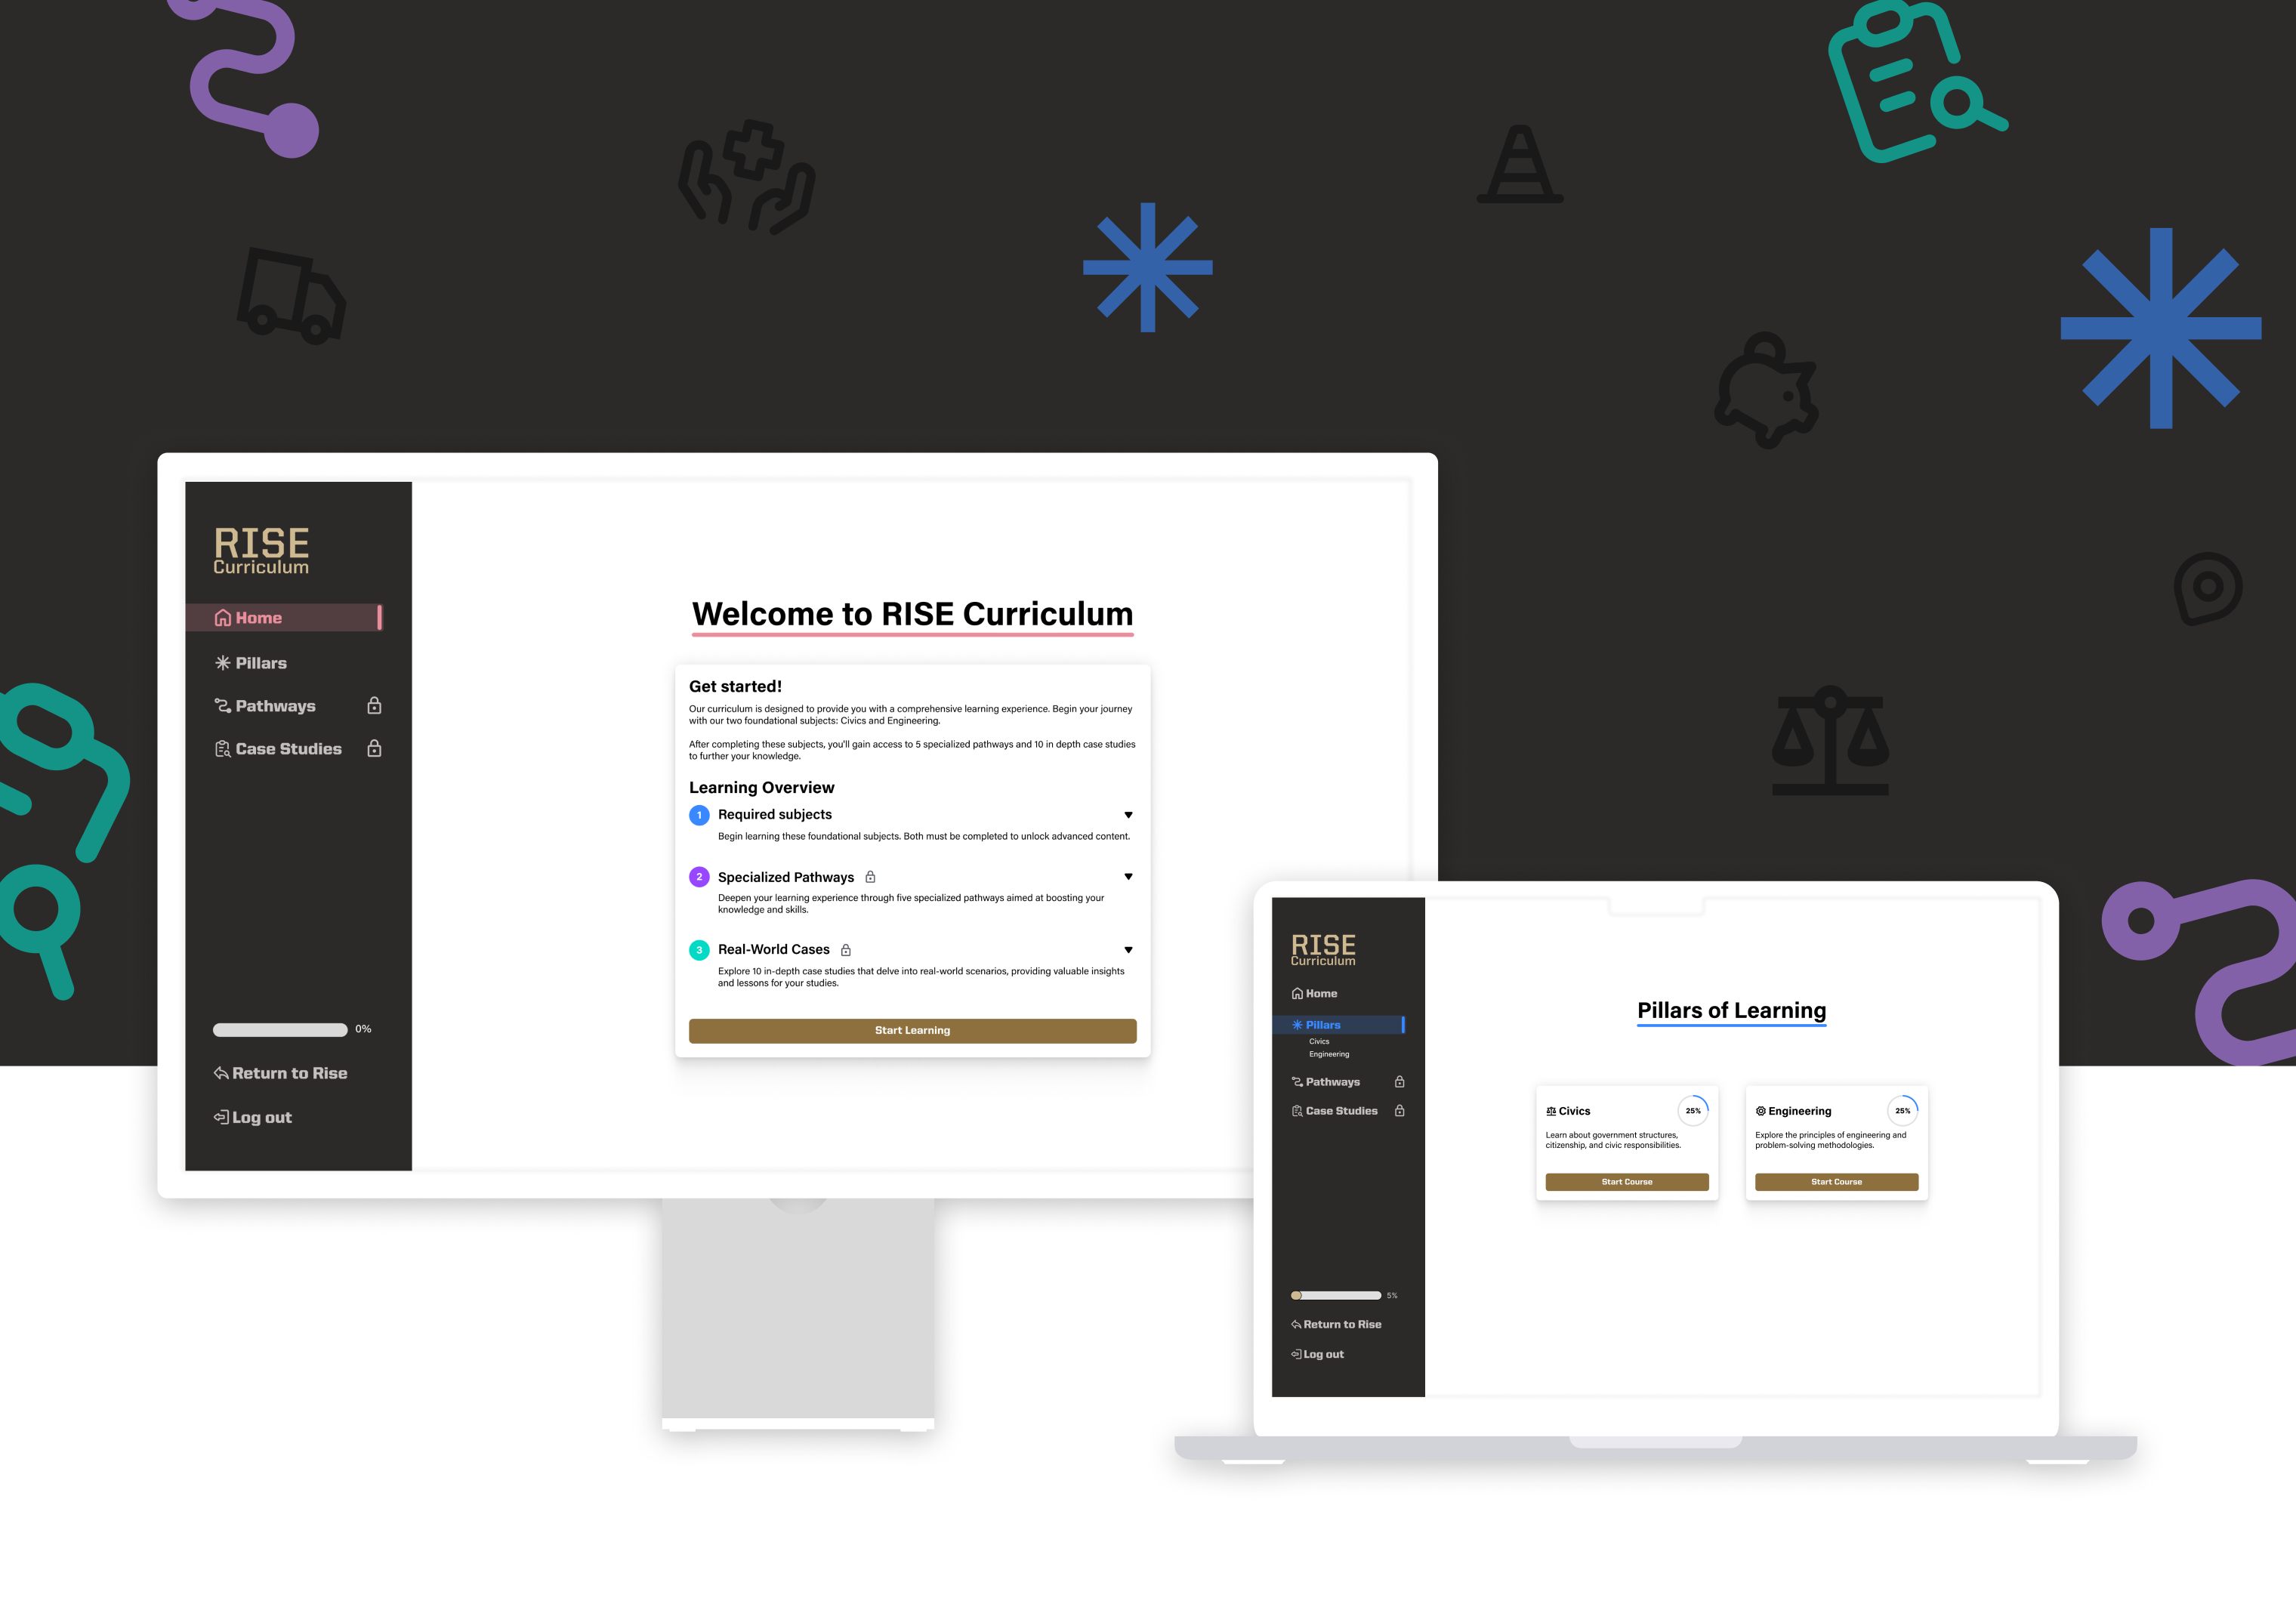
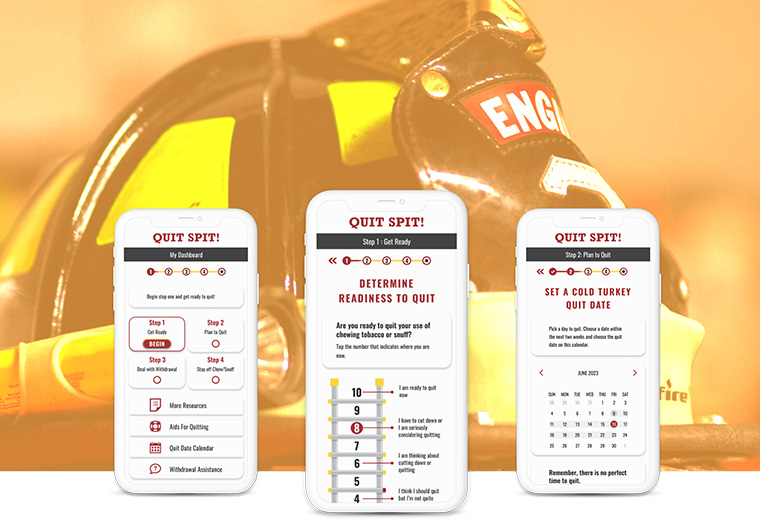
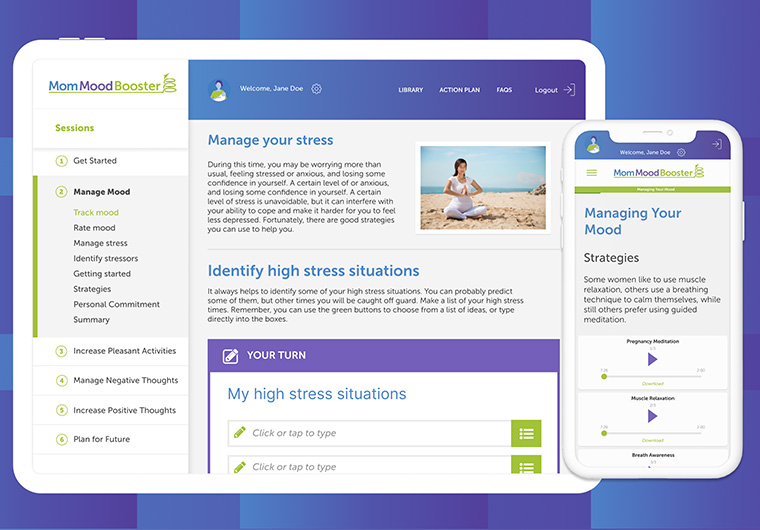
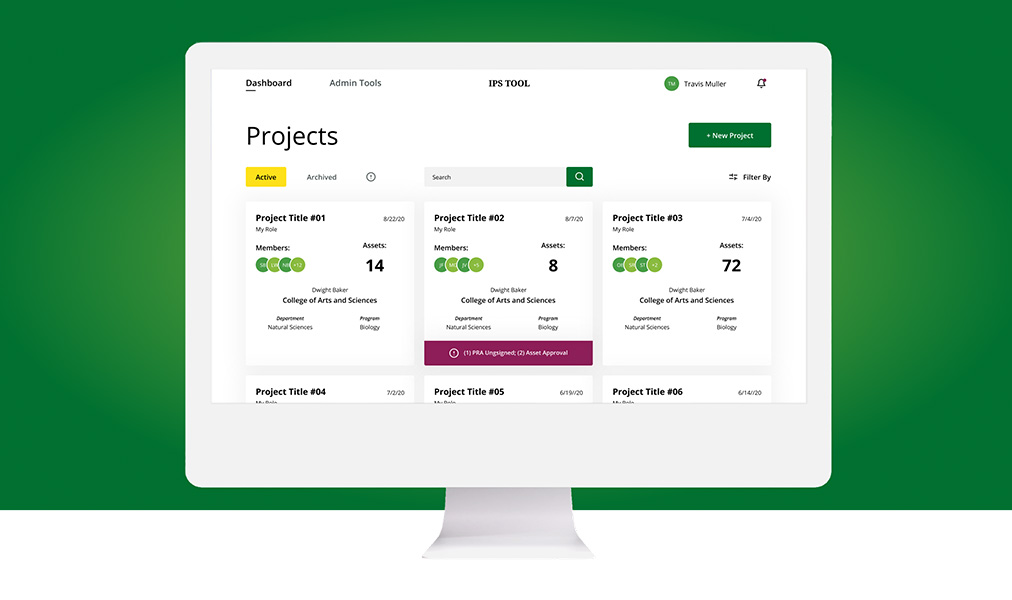
The EARS research team approached Emberex with a concept for the back-end of a user research mobile application. They left with a well-rounded & refined data visualization interface. It was essential that the app communicated high priority information but also allowed for deeper analysis of each participant by the researchers. Each study conducted could have hundreds of participants, so being able to see overall trends while still allowing for granular details about individual participants was paramount.
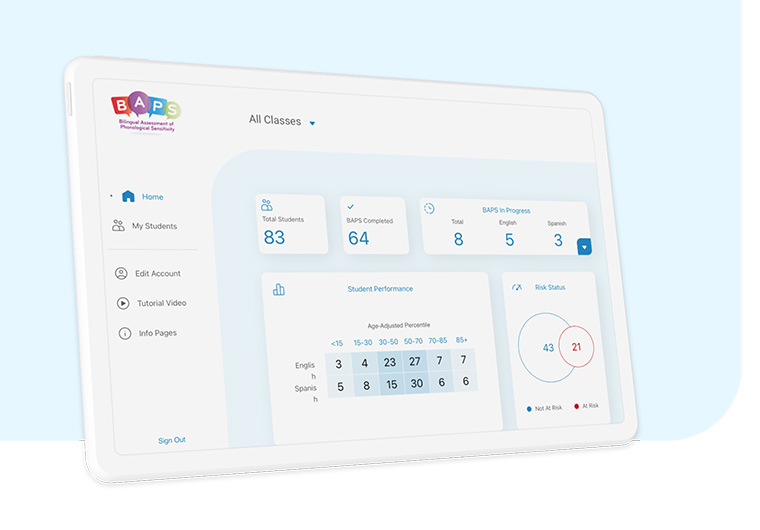
THE PROCESS
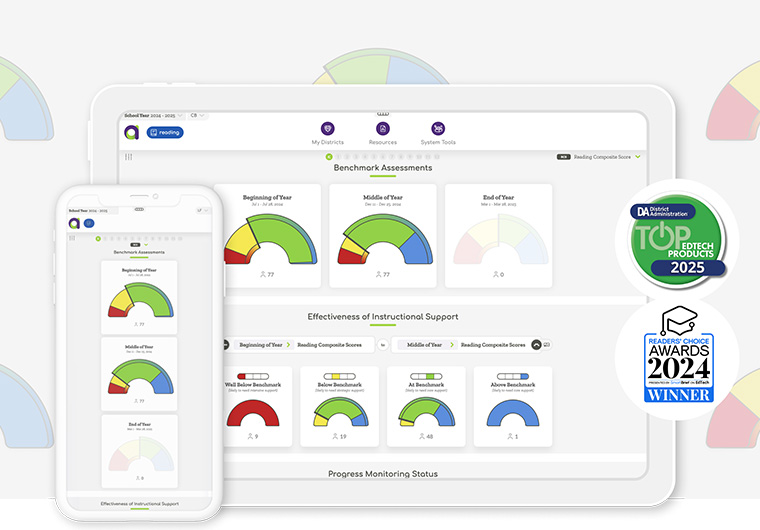
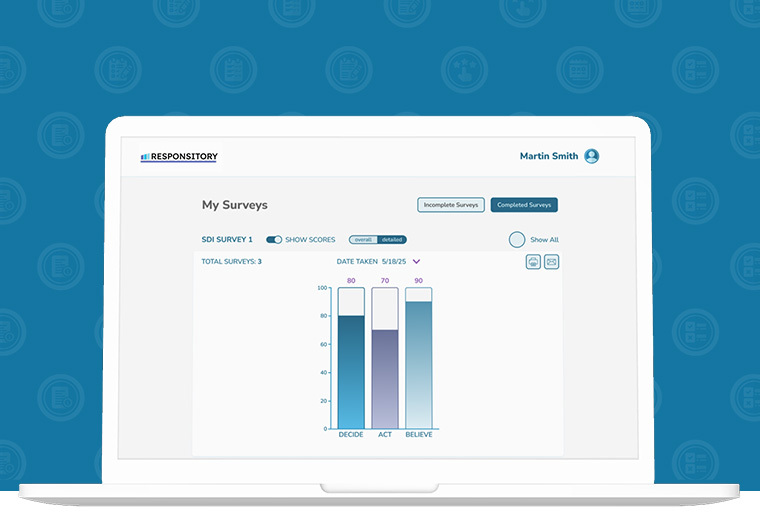
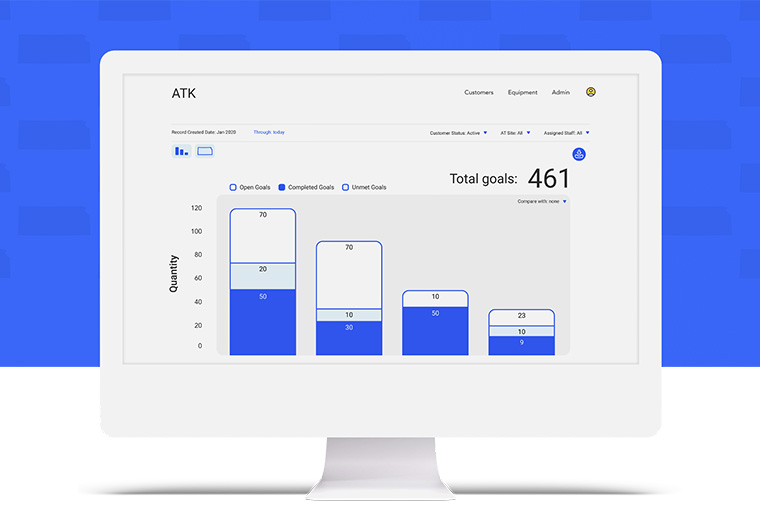
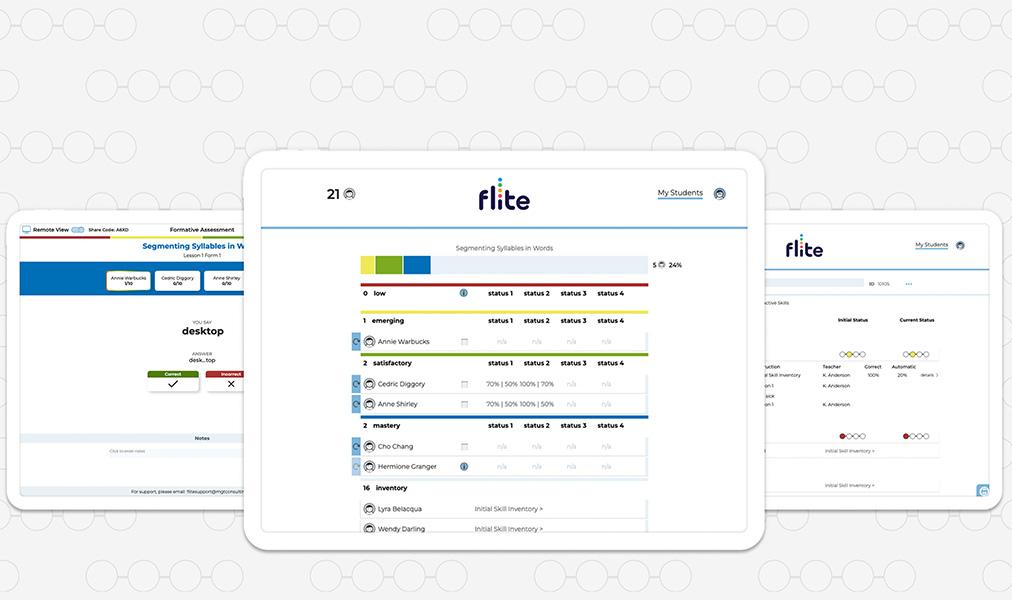
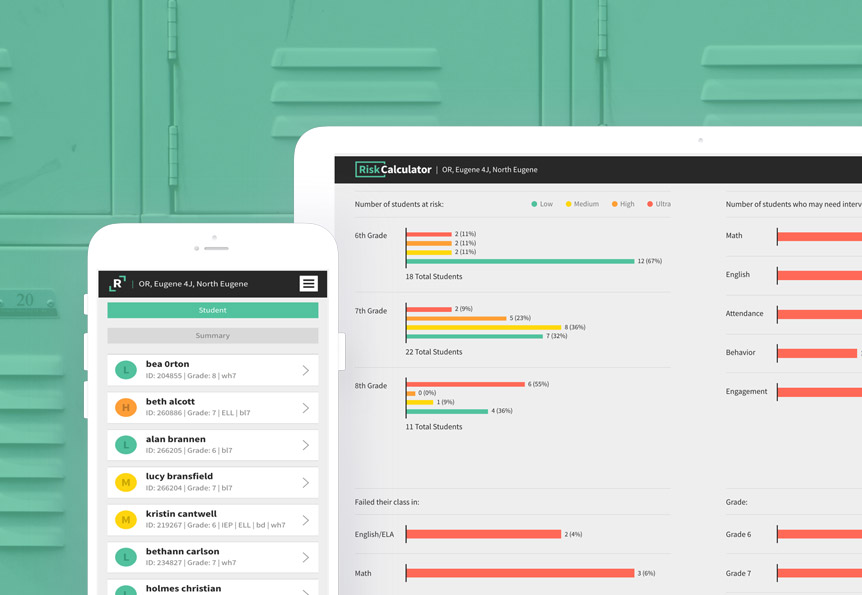
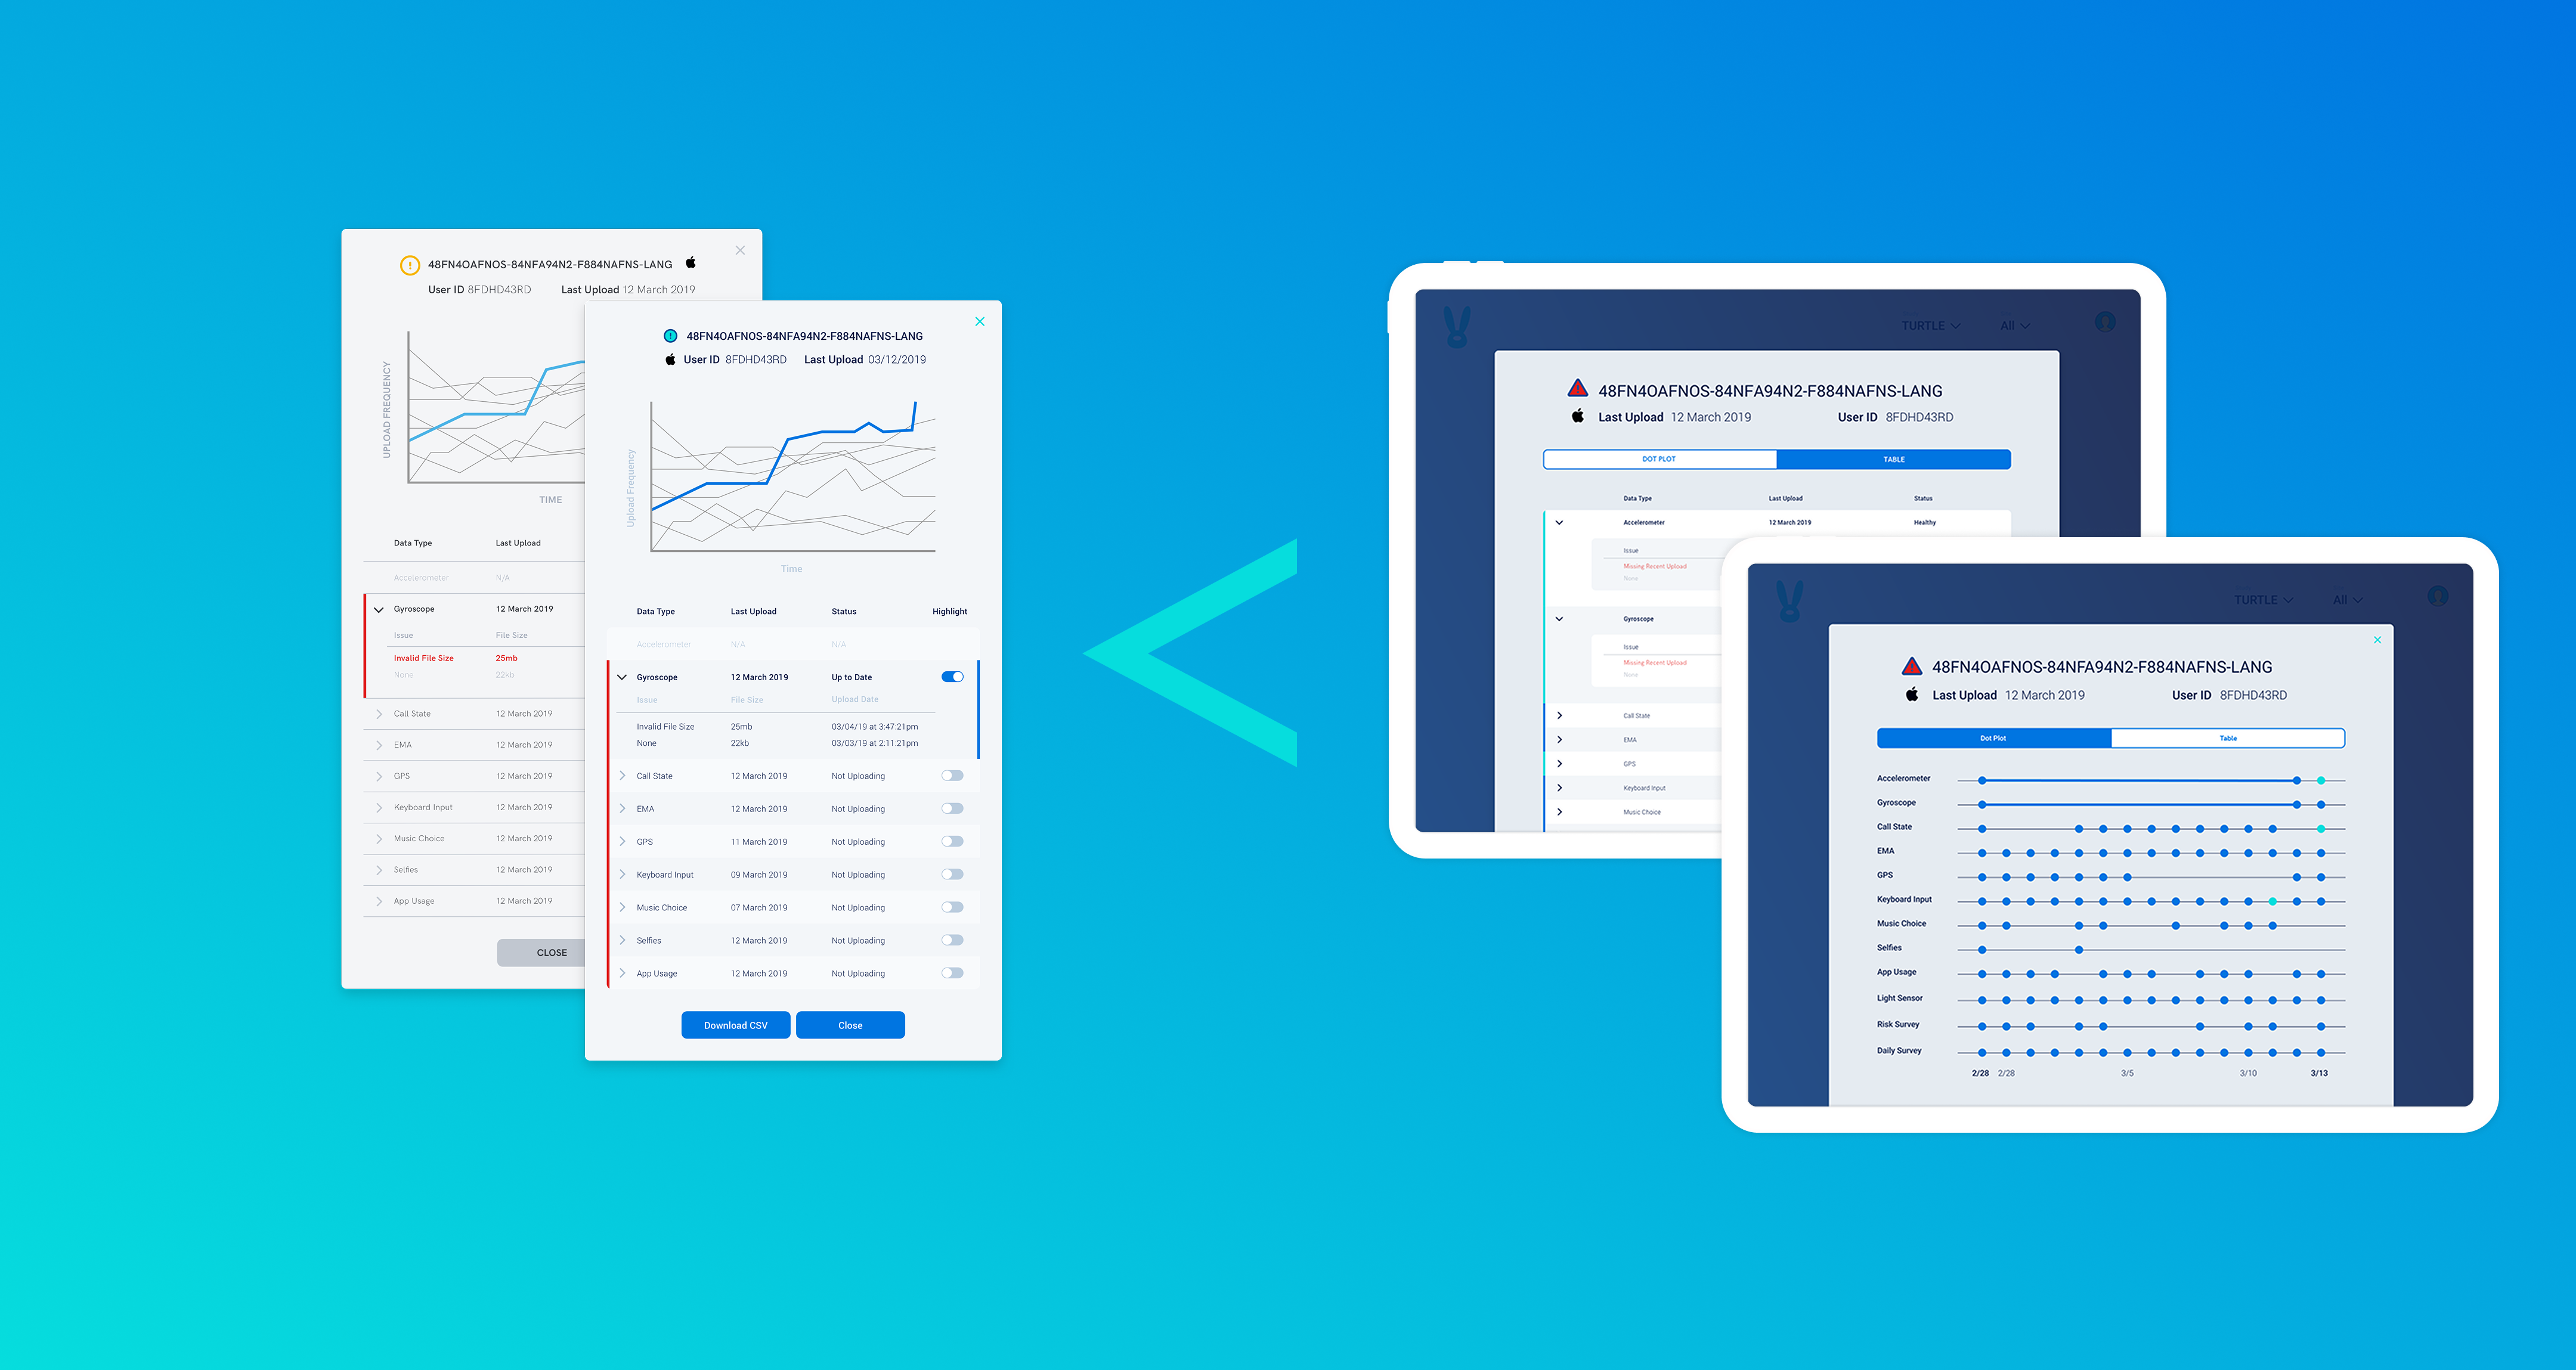
We initally presented wireframes that utilized modals to keep the page complexity down. The idea was to create a simple dashboard that allowed for reasearchers to get into the nitty-gritties and view detailed reports. Despite the simple concept, the solution became more nuanced than initally expected. The design team at Emberex decided upon a chart we call the “Time-Based Xeno-Quantum-Particle Dot Plot” or TBXQPDP, pronounced “Tibex Quap Padoop” (pictured above).
This data visualization interface allowed for granular view of a participant’s sensors without sacrificing overall trends or comparisons.
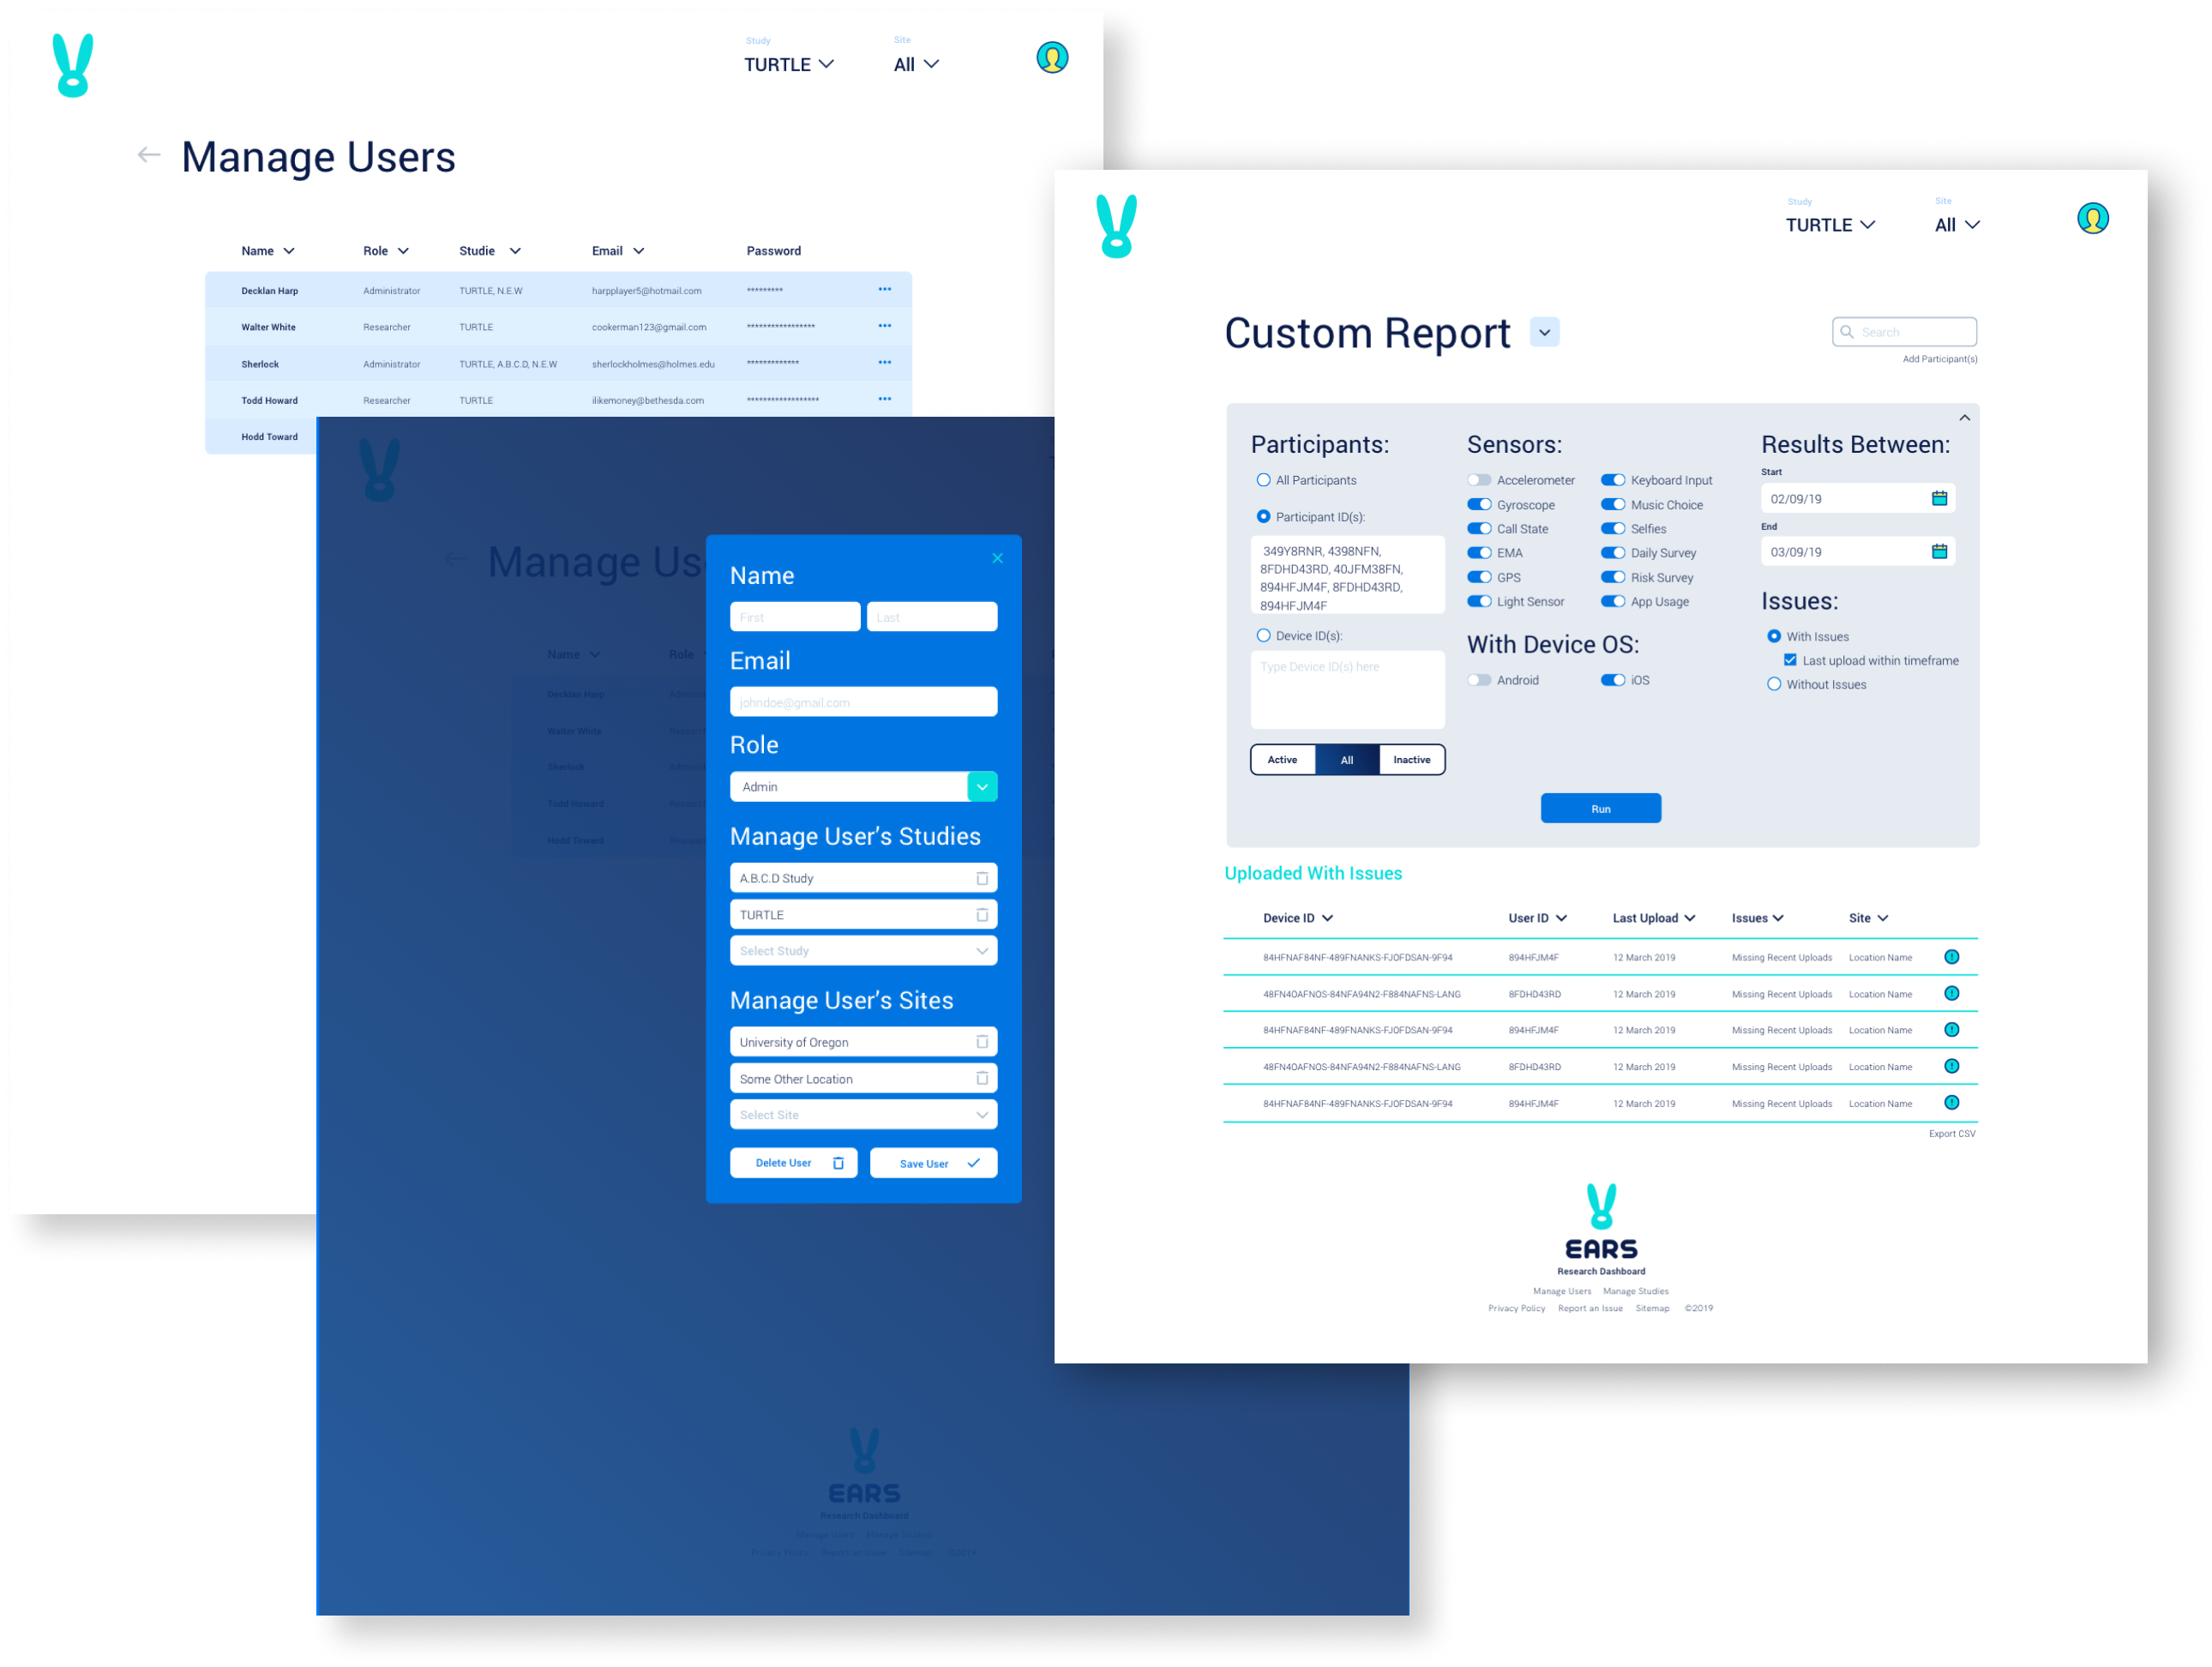
THE RESULTS
The EARS research team was delivered an intuitive & simple data visualization interface that didn’t sacrifice ease of use for detail, nor detail for ease of use.
TECHNOLOGY
Node.js, React, TypeScript, DynamoDB, AWS Lambda
Social Media
© Emberex, Inc. All rights reserved | View our terms and conditions